Dashboard Overview
The Event Dashboard gives you a complete view of your organization's event activity. This page walks you through every section of the dashboard so you know exactly where to find what you need.
Page Header
At the top of the dashboard you will see:
- Page title -- "Events & Signups" with a brief description.
- Create Event button -- Located in the top-right area. Select this to start creating a new event. This button is only visible if you have permission to create events in your organization.
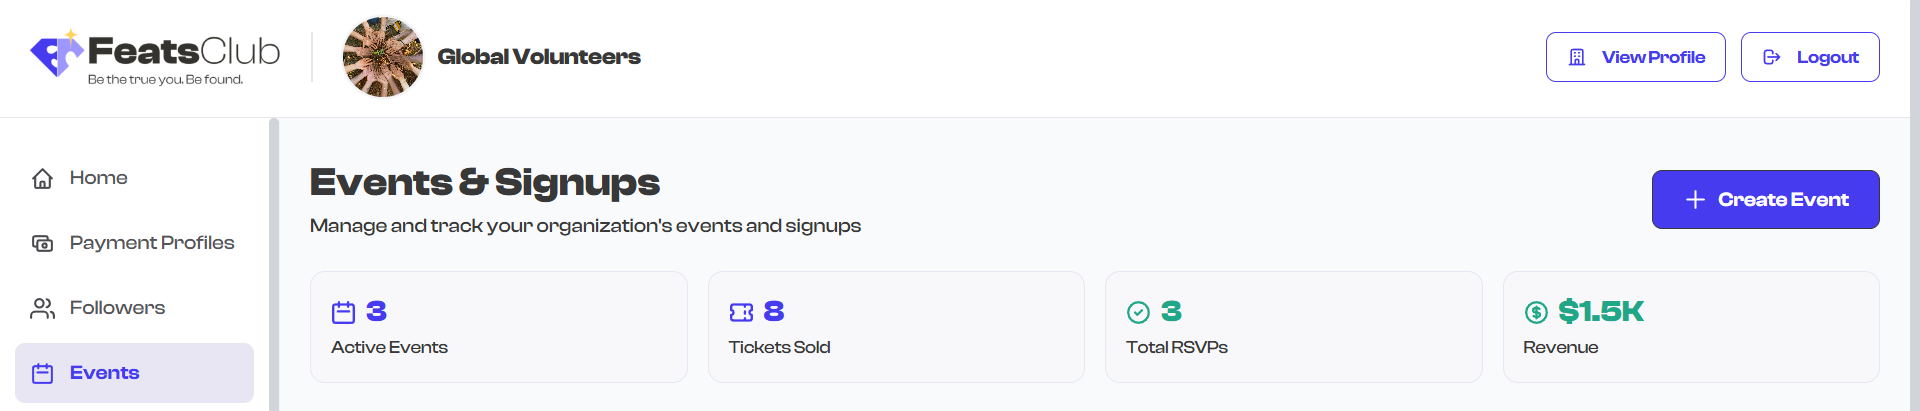
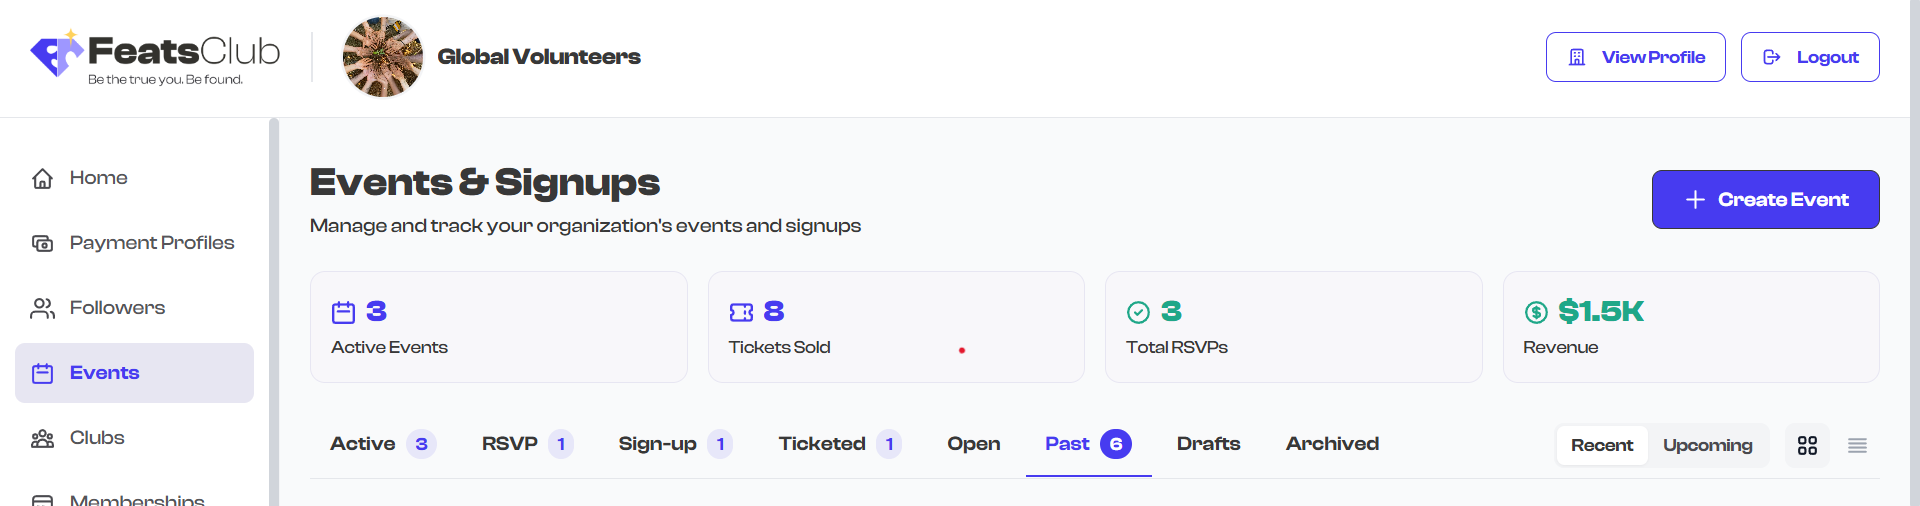
Stats Cards
Below the header, four stat cards provide a real-time summary of your active events. These stats are calculated only from your currently active events -- drafts, past events, and archived events are excluded.
| Stat Card | What It Shows |
|---|---|
| Active Events | The total number of events that are currently live (published and not expired) |
| Tickets Sold | The combined number of tickets sold across all active ticketed events |
| Total RSVPs | The combined number of RSVP responses received across all active RSVP events |
| Revenue | The total revenue generated from ticket sales across active events, displayed with the appropriate currency symbol |
Revenue is calculated from active ticket sales only, excluding any canceled ticket revenue. The currency symbol ($ or Rs.) is automatically detected from your first ticketed event's payment configuration.
How Stats Are Calculated
- Active Events counts events with status "ACTIVE" that have not yet expired. It includes all event types: Ticketed, RSVP, Sign-up, and Open.
- Tickets Sold sums the total ticket count across all active ticketed events.
- Total RSVPs sums RSVP user counts for all active events that accept RSVPs.
- Revenue adds up the active (non-canceled) revenue from each ticket type across all active ticketed events.
Large numbers are displayed in compact format for readability. For example, 1,500 tickets appears as "1.5K" and 2,000,000 in revenue appears as "$2.0M".
Filter Tabs
Directly below the stat cards, you will find eight filter tabs. Each tab shows a count badge when there are events in that category. See Filtering Events for detailed information on each tab.
View Mode Toggle
To the right of the filter tabs, two small icons let you switch between grid view and list view. See Grid and List View for details.
Event Listing Area
The main body of the dashboard displays your events based on the selected filter tab and view mode. Each event appears as a card showing key details like the event image, type, title, date, venue, and pricing information.
When the dashboard is loading, placeholder skeleton cards are displayed to indicate that content is being fetched.
Empty State
If your organization has no events yet (or no events matching the current filter), the dashboard displays a contextual empty state:
For the Active tab with no events at all, a welcome screen appears with:
- A heading inviting you to launch your first event
- A description of what you can create
- Feature highlights showing the four event types: Ticketed Events, RSVP Invites, Sign-up Forms, and Recognize & Celebrate
- A prominent "Create Your First Event" button

For specific filter tabs with no matching events, a simpler message appears. For example, selecting the "Ticketed" tab when you have no ticketed events shows "No ticketed events" with the message "Events with tickets will appear here."
The empty state on the Active tab is a great reminder of everything you can do with FeatsClub events. Even after you have created events, you can revisit this by switching to a filter tab that has no matching events to see what that category is for.